Instagram Story Analytics gives creators, businesses, and agency strategists the precise behavioral data needed to understand how audiences consume daily, ephemeral visual content. While main feed posts offer curated snapshots, Stories act as a real-time focus group. They reflect immediate viewer interest, attention spans, and buying intent. However, most accounts check the bottom left viewer list, celebrate a high view count, and completely ignore the deeper analytics dashboard that dictates long-term growth.

If you want to turn casual viewers into dedicated followers, brand advocates, or paying customers, you must audit your data beyond surface-level numbers. You need to distinguish vanity metrics from actionable metrics. This comprehensive guide breaks down the critical Story metrics that directly influence Instagram’s ranking algorithms, drive conversion pipelines, and help you systematically refine your overall digital strategy.
The Inner Workings of Instagram Story Distribution
Instagram does not display Stories in chronological order. Instead, the platform relies on a sophisticated ranking algorithm designed to maximize user session time. Every time an account posts a frame, the algorithm evaluates hundreds of behavioral signals across three primary buckets: interest, relationship closeness, and recency.
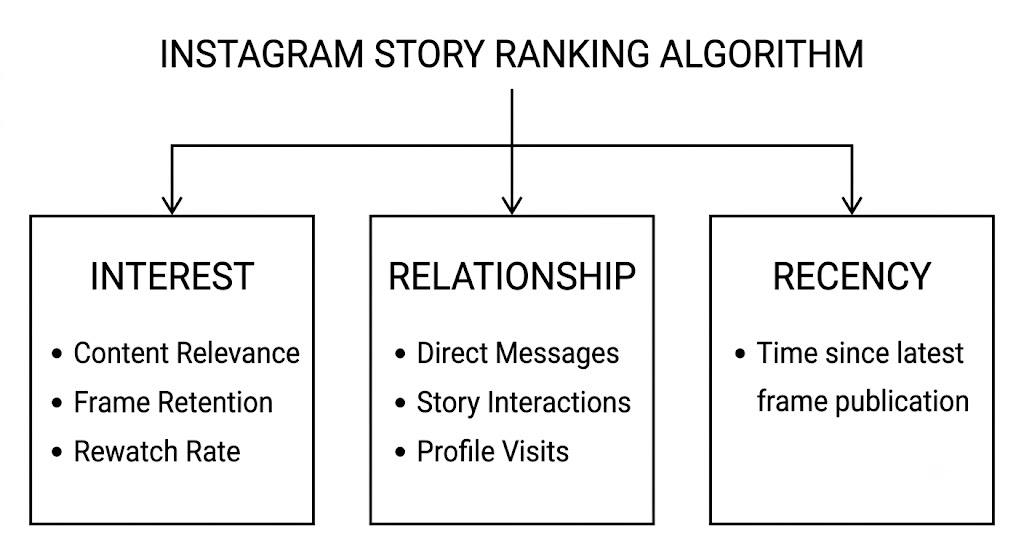
Understanding viewer intent helps you build a scalable content model. When a viewer opens your first frame and immediately swipes left to move to the next account, Instagram interprets that action as a negative signal. The system assumes your content failed to capture interest. Conversely, when a viewer taps back to re-read your text, interacts with a poll sticker, or sends a direct message reply, the algorithm registers a high-affinity connection.
Accounts that consistently generate these positive interaction signals earn front-row positioning in their followers’ Story trays. Building real distribution on Instagram comes down to optimizing for viewing depth and high-intent engagement.
The 7 Core Instagram Story Metrics (Detailed Deep Dive)
Completion Rate
Completion rate measures the exact percentage of unique accounts that watch your entire Story sequence from the initial frame through to the final slide.
- Why it matters: This calculation serves as your primary diagnostic tool for content quality. A dropping completion rate indicates that your narratives drag, your messaging lacks clarity, or your sequences contain too many frames. High completion rates inform the algorithm that your account holds user attention, triggering expanded distribution.
- How to analyze it: Compare completion rates across different story formats (e.g., behind-the-scenes vlogs vs. educational slides vs. product launches) to identify your strongest narrative structures.
- How to improve it: Limit standalone narrative arcs to 3 to 5 frames. Always open with a strong visual hook and clear text on screen to immediately establish value.
Tap Backs
A tap back occurs when a viewer touches the left side of the screen to rewatch your previous frame or review a slide they passed too quickly.
- Why it matters: Tap backs represent one of the clearest indicators of viewer interest and intent. Viewers do not tap back by accident. They tap back to re-read dense text, inspect fine details in a visual, slow down a fast transition, or listen to audio again.
- How to analyze it: Track frames that earn disproportionately high tap backs. Identify common elements like step-by-step breakdowns, detailed infographics, or high-value recommendations.
- How to improve it: Publish detailed slides, listicles, or high-value quotes that demand a second look. Avoid cluttering the slide; structure text so it invites detailed reading.
Tap Forwards
A tap forward means the viewer touched the right side of the screen to skip directly to your next frame without waiting for the current slide’s timer to run out.
- Why it matters: Tap forwards provide immediate feedback on pacing and fatigue. While high tap forwards are common on text-heavy slides read quickly by fast readers, a sudden spike on video clips signals that your content feels slow, repetitive, or uninteresting.
- How to analyze it: Calculate the ratio of tap forwards against your total view count for every frame. If tap forwards jump significantly on a specific slide type, adjust that format.
- How to improve it: Keep video talking heads concise, cut out filler words, use dynamic captions, and change camera angles or visual elements every 3 to 5 seconds.
Exits
An exit occurs when a viewer leaves your Story entirely by closing the application, swiping down to the main feed, or returning to the home screen.
- Why it matters: Exits highlight your biggest drop-off points. Unlike tap forwards (where viewers stay within your sequence), exits mean viewers abandoned your content completely.
- How to analyze it: Map your exits frame by frame across an entire sequence. Identify the exact moment viewers leave so you can remove those friction points from future scripts.
- How to improve it: Eliminate abrupt sales pitches without prior context, avoid blurry or low-quality video files, and refrain from posting endless unedited talking-head videos without visual breaks.
Sticker Taps
This metric records total interactions with interactive elements, including poll stickers, quiz options, slider widgets, question boxes, and external link stickers.
- Why it matters: Passive viewing requires zero effort, whereas tapping a sticker demands conscious action. Interactive taps convert passive audience members into active participants. The algorithm heavily rewards accounts that generate high interactive engagement.
- How to analyze it: Divide total sticker taps by unique reach to establish your true engagement rate for a specific frame sequence.
- How to improve it: Place simple binary polls (e.g., “Yes or No”, “This or That”) early in your Story sequences to build early interactive momentum.
Direct Message Replies
Direct Message (DM) replies reflect the total number of direct text responses, emoji reactions, or slide shares generated directly from a specific Story frame.
- Why it matters: DM replies represent the highest-value relationship signal on Instagram. When a viewer messages your account, Instagram tags that relationship as close friends or high-affinity connections. This interaction significantly boosts your future reach across Stories, Feed Posts, and Reels.
- How to analyze it: Identify which specific frame formats inspire conversations versus passive views.
- How to improve it: Ask direct, relatable, open-ended questions. Instead of saying “Link in bio”, ask viewers to reply with a specific word (e.g., “Reply ‘PLAN’ to get the full guide directly in your DMs”).
Navigation vs. Discovery Reach
Navigation metrics break down total viewer movements (Taps Back, Taps Forward, Next Story, Exits), while discovery reach separates existing followers from new profiles viewing your content.
- Why it matters: Tracking viewer sources lets you determine whether your content primarily serves audience retention or brand discovery.
- How to improve it: Add targeted location tags, encourage followers to share specific frames to their own Stories, and collaborate with complementary creators to pull new audiences into your viewer pipeline.
How to Calculate Story Completion Rate
To calculate your Instagram Story Completion Rate, divide the total number of unique viewers who watched your final frame by the total number of unique viewers who watched your first frame, then multiply the result by 100.
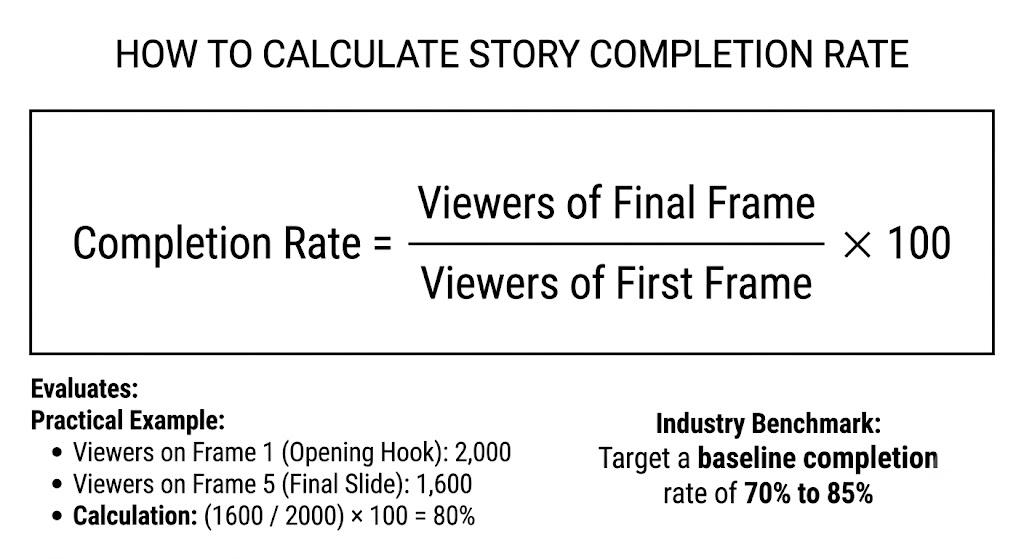
- Practical Example:
- Viewers on Frame 1 (Opening Hook): 2,000
- Viewers on Frame 5 (Final Slide): 1,600
- Calculation: $(1600 / 2000) \times 100 = 80\%$
- Industry Benchmark: Target a baseline completion rate of 70% to 85% for short sequences (3 to 5 frames) to maintain healthy account algorithmic authority.
Demystifying Algorithmic Signals
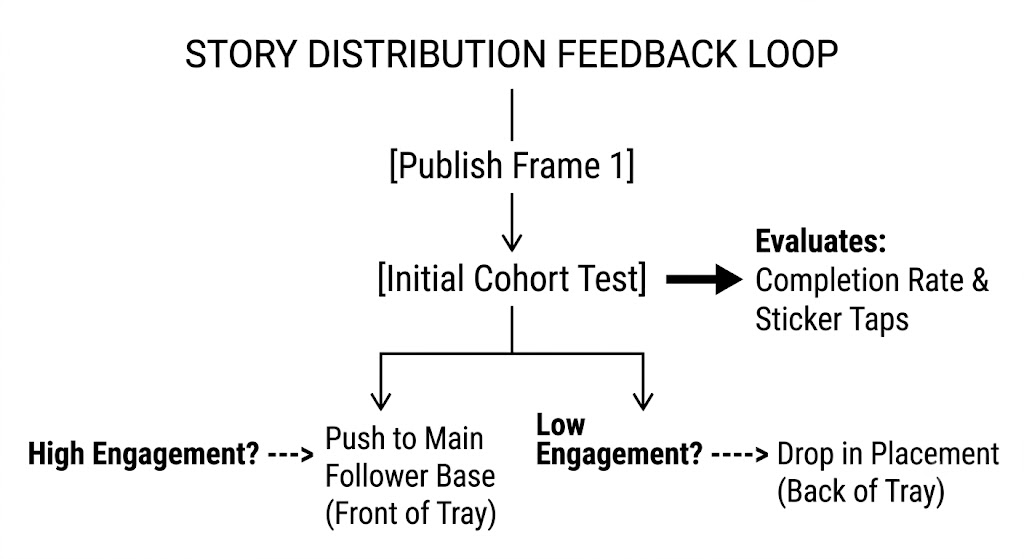
Instagram evaluates real-time performance within the initial distribution window after you publish a frame. When you release a new Story, the platform shows it to a small test cohort of your most engaged followers. If this test group logs high completion rates, taps back to rewatch, or engages with stickers, the system pushes your story icon to the front of the line for the rest of your follower base.
Furthermore, 1-to-1 conversation loops carry systemic platform weight. When an account generates strong DM activity through Story replies, Instagram’s ecosystem recognizes that connection as priority relationship context. As a result, your main feed posts and Reels will also appear higher in those specific users’ feeds. Building an active Story environment strengthens account-wide performance.
Step-by-Step Execution Plan: Content Optimization Based on Analytics
Transforming raw metrics into actionable content strategies requires systematic testing. Apply this structured execution framework to build high-retention Story sequences:
| Strategy Focus | Primary Metric Targeted | Tactical Implementation | Expected Outcome |
|---|---|---|---|
| The Visual Hook | Completion Rate & Exits | Open Frame 1 with high-contrast text, direct eye contact, or a clear value proposition. | Lowers immediate Frame 1 exits by setting immediate viewer expectations. |
| Early Frictionless Interaction | Sticker Taps | Insert a simple binary poll (e.g., “Agree or Disagree?”) on Frame 2. | Builds low-effort interactive momentum early in the sequence. |
| Pacing & Layering | Tap Forwards | Alternate talking-head clips with graphic slides, kinetic text, and short visual cuts every 3 seconds. | Keeps visual interest high and reduces tap-forward skip rates. |
| Conversational CTAs | DM Replies | End sequences with a personal, open-ended question prompt instead of a generic external link. | Triggers high-value relationship signals with the algorithm. |
Debunking Common Instagram Story Myths
Myth 1: Absolute view count is the main indicator of success.
Reality: High view counts combined with low completion rates indicate poor audience retention. A smaller, highly attentive audience that watches every slide and sends DMs yields far higher conversion rates than a passive crowd that skips your content.
Myth 2: Posting 20+ frames daily boosts visibility.
Reality: Excessive posting triggers viewer fatigue, causing exit rates to skyrocket. Focus on delivering tight, well-structured 3 to 7 frame narrative arcs that deliver clear value without overwhelming your audience.
Myth 3: Hashtags on Stories drive meaningful discovery.
Reality: Instagram lowered discovery weighting for hidden hashtags within Stories years ago. Overloading frames with hidden tags creates unnecessary background clutter without driving meaningful reach. Instead, rely on clear location tags, user tags, and organic direct shares.
Conclusion
Mastering Instagram Story Analytics requires shifting your focus away from surface vanity metrics and toward deep audience behavioral signals. By systematically tracking completion rates, tap backs, exits, and DM replies, you gain direct visibility into what truly resonates with your audience. Treat your analytics dashboard as a live operational map: double down on formats that earn high rewatches, prune content styles that drive exits, and build direct conversational touchpoints to capture maximum algorithmic distribution.