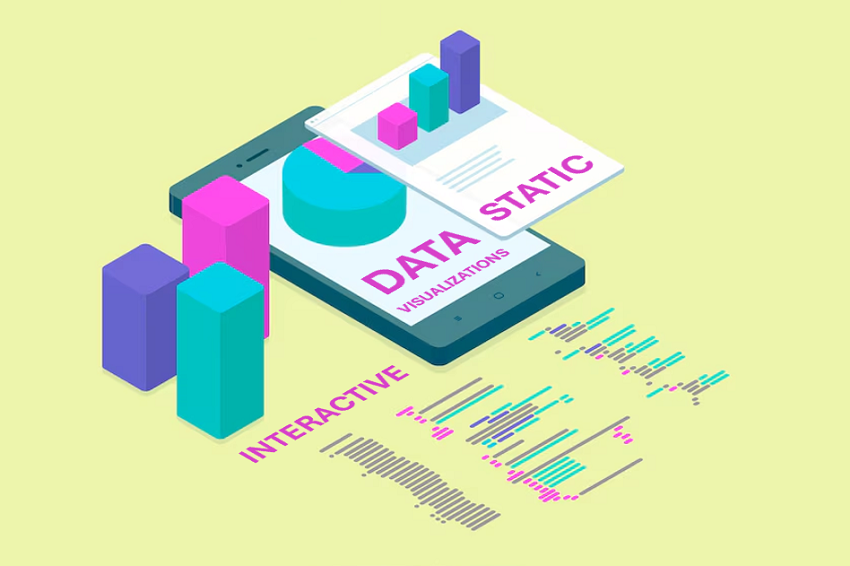
Static vs Interactive Visualizations: This is the question that many people pose in a bid to know when it is appropriate to use each of the above types of resumes.
Visualization is the presentation of information in graphical interfaces that provide easier ways of understands insights, trends and information. Static and interactive are the two forms of visualizations that are grouped based on properties belonging to the visualizations.
Thus, based on the objective of the data visualization and the requirements necessary for the target audience, it is preferable to define which option is most appropriate for the given task. Awareness of the specifics of the static and of the interactive visuals will help to define the further actions regarding the using of the certain data to demonstrate.
Based on this, in this blog, we will discuss more details about differences between static vs interactive visualizations, the pros and cons of using each, and recommend when it is better to use one or the other. As a result of the visualization types to be discussed at the end of the article or video, you will be in a better position to choose which type would suit your needs in information visualization that provides informative data and valuable data for your business.
Static vs Interactive Visualizations: Differences Explained
| Aspect | Static Visualizations | Interactive Visualizations |
| Definition | Fixed visual representations of data, such as infographics or charts. | Dynamic visualizations that allow user interaction to explore data. |
| User Engagement | Limited engagement – users view the data as presented without interaction. | High engagement – users can manipulate data to uncover insights. |
| Data Exploration | Focused on a specific data story; users cannot explore beyond the presented view. | Enables exploration of multiple data stories through user actions. |
| Update Capability | Does not change unless edited by the creator; remains the same over time. | Can update in real-time based on user input or data changes. |
| Complexity | Generally simpler to create and understand; suitable for straightforward messages. | More complex to create; requires understanding of user interface design. |
| Use Cases | Ideal for reports, presentations, and print media where a single message is needed. | Best for dashboards, data analysis tools, and web applications where user interaction is beneficial. |
| Tools | Created using basic graphic design tools or software like Adobe Illustrator. | Developed using specialized tools like Tableau, D3.js, or Google Charts. |
| Accessibility | Easily accessible to all users without the need for technical skills. | May require some level of technical skill or familiarity with the interface. |
Understanding Static Visualizations
Hence, static visualizations are images that offer a static view of the data in a non-usable format. They are ordinary and non complex and may commonly be found in reports, articles, presentations, and any printed or static electronic document. Nonetheless, being non-interactive, static visualizations serve as perfect tools for showing rather simple information in an eye-catching manner. The categories of static visualization include bar charts, pie charts, lines, and infographics.
Characteristics of Static Visualizations
- Non-Interactive: Based on their problem-solving capacity and the implementation of the identified components, one of the most distinctive characteristics of static visualizations is that they are non-interactive. Regardless of how they are created, they cannot be edited or manipulated by the user. The viewer receives a fixed presentation of the data.
- Snapshot of Data: Static visualizations provide a single view of the data, typically representing a specific point in time or a particular dataset. If new data becomes available, a new static visualization must be created.
- Simplicity: The primary focus of static visualizations is clarity and simplicity. These tools are intended to provide the user with the most essential information about the analyzed data immediately and without distractions.
- Limited Exploration: Unfortunately, these visuals are static, which means they do not allow the viewer to pivot, that is, move to other levels of specifics and data filtering.
Advantages of Static Visualizations
One can argue that static visualizations have many disadvantages because they are fixed and final. However, one has to state that static structures outperform in several aspects of their application, and that’s why there are many demands for static visualizations in many specters of data representation.
- Ease of Creation: In terms of development, static charts are comparatively easier and faster to create than dynamic ones. Microsoft Excel, Google Sheets, Shiny, and Tableau are examples of tools that take a few minutes to create static charts, even for a beginner.
- Widespread Compatibility: Static visuals are pictures or images, such as PDF files, that can be used on printed media, websites, or presentations. They do not require other programs and plug-ins to be downloaded in order to be watched or viewed.
- Simplicity and Clarity: Static visualizations are less complicated, which makes them easier to interpret at a glance. The viewer does not have to play with the data, click on it, or move it to understand the message being passed across; it’s straightforward.
- Consistency Across Viewers: Static visuals provide all the viewers with a glimpse into the representations to enforce consistency in the process since they allow the same picture to be viewed by all, allowing them to draw similar conclusions.
- Fast Loading Times: They(images) have less size in terms of bytes and can be quickly displayed on-site when there is limited bandwidth. This makes them suitable for use in presentations, emails, and other communication channels where speed is of the essence.
Limitations of Static Visualizations
Despite their benefits, static visualizations have several limitations that can make them less effective in certain scenarios.
- No Interactivity: The biggest limitation is the lack of interactivity. Users cannot manipulate the data, explore alternative scenarios, or filter the information to suit their needs. This can be a disadvantage when dealing with complex data that requires deeper exploration.
- Limited Data Representation: Static visualizations typically focus on representing one dataset or time point. If you need to show multiple data points or scenarios, you would need to create several static visuals, which can clutter the presentation.
- No Real-Time Data Updates: Static visualizations cannot be updated from the time they are created to the time new data is generated. For instance, if one operates within a field that constantly updates its datasets in a short while, having a static visualization may be counterproductive since the visual may go stale almost immediately.
- Simplification of Complex Data: Although this makes the algorithm’s execution very easy, the method may not work very well, especially when dealing with intricate data. It is possible that the static presentation of the data misinterprets certain elements or leaves out specific trends or relations that could be found under detailed analysis.
Understanding Interactive Visualizations
Interactive visuals are different from other still images since users can interact with the information presented to them. They allow viewers to learn more and dig deeper into the attachments by hovering, clicking, filtering, and drilling down on the data set. Such as Salesforce, Exposure, tables, and charts, a dashboard is typically utilized in organizations or companies where people require up-to-date or individualized data regarding the organization.
Characteristics of Interactive Visualizations
- User Interaction: This is why the key feature of interactive visualizations is focused on the user’s interaction with the data. It gives the user the ability to change the values of the variables of interest, change the filters, zoom in on the points one is interested in, or perform other operations to get a finer insight into the data being processed.
- Real-Time Data Updates: Most animated and motion graphics are usually linked to data streams that can be updated as and when more data is received. This makes them suitable for use in changing contexts, such as stock market performance indicators or sales agent performance.
- Multidimensional Data Representation: Interactive visualizations can present multiple datasets or variables simultaneously. Users can switch between views, compare different datasets, and explore the data from various angles.
- Dynamic and Responsive: These visualizations are often designed to respond dynamically to user inputs, providing instant feedback. For example, users can filter by a specific time range or category and see the data update immediately.
Advantages of Interactive Visualizations
- Better for Complex Narratives: Interactive visualizations can guide users through complex stories by unfolding data step by step. This makes them ideal for presenting data with multiple layers or requiring users to follow a narrative path to fully understand it.
- Increased Engagement: Animated objects allow users to interact with the information displayed. It becomes easier for them to find hidden information that may not be easily seen while using a conventional figure. This feature could possibly help make the experience engaging and fun and enable the user to learn something in-depth about the data.
- Customizable Views: Not only are controls available that enable users to change the parameters of the dataset but there are also methods that allow users to change the view of the data. This lets them work on some of the other factors of the data that they consider essential in their endeavors.
- Deeper Data Exploration: As with other visualizations, there are differences in how they are applied based on the sizes and types of datasets; interactive types are beneficial where large and rather complicated datasets are involved. As they have a dynamic nature, they enable the users to interact with multiple layers of data and details and inspect the existing or new trends or relations that are not visible in the static visuals.
- Real-Time Updates: Dynamic images linked to the original databases ensure that adjustments are real-time, and thus, the most recent figures are presented. This is especially important in decision-making when the data set is changing, as may be the case with business today.
Limitations of Interactive Visualizations
- Higher Development Costs: Producing interactive visualizations is more costly than producing non-interactive ones. They require more time and effort to present the facts, and they are usually best done in tools such as Tableau or Power BI or developed in code using languages such as D3. Js.
- Technical Complexity for Users: While interactive visualizations provide more freedom and are somewhat helpful, there are substantial drawbacks: They are somewhat confusing for an average user who does not practice working with such applications. While extending the concepts familiar from movies into computational systems is possible, poorly designed interactivity only creates confusion.
- Slower Load Times: Interactive visualizations contain all the calculations and data that are to be displayed in real-time, so they take time to load compared to static visualizations. This is detrimental to the built user experience, especially when running on a low-processing device or slow internet connection.
- Platform Compatibility Issues: Interactive visuals may also display fewer sources than static ones. For example, they might not display correctly on older browsers or devices, which means that they will be inaccessible to the specific public.
When to Use Static Visualizations
Static visualizations are ideal for scenarios where simplicity and clarity are the priority. Here are some everyday use cases where static visuals excel:
- Reports and Print Media: Since static visualizations are fixed images, they work well in reports, whitepapers, presentations, and other print materials where interaction isn’t possible or needed.
- High-Level Overviews: If the intent is not to give detailed data analysis, static visuals are the most effective way to offer perspective on the information presented in the simplest form.
- Situations with Limited Access to Technology: Some of the data presented to the audience may not be easily interpreted or interacted with, and hence, if the audience is being presented with print materials or simple presentations, then static visuals are quite useful.
- Quick Insights: Static visualizations are easier and quicker to design and deploy, so they are suitable for use when information needs to be delivered quickly.
When to Use Interactive Visualizations
Explorative data visualizations are more appropriate for providing detailed and deeper insights into the data as well as experiences that demand more input from the users. Here are some ideal use cases:
- Exploratory Data Analysis: For instances where the users want to analyze the contents independently, using dashboards, BI tools, or analytics applications, tight focusing is not the goal; instead, interactive visualizations fit the task best, as they offer the possibility of deep data investigation.
- Presenting Complex Data: When dealing with large matrices of data with several parameters or dimensions, users are able to hover and zoom, filtering in and out parameters in the matrix to find correlations that may not be easily recognized from static visuals.
- Real-Time Monitoring: Dashboard widgets that incorporate real-time data are required to monitor various parameters, such as sales and website traffic, in real-time.
- Data Storytelling with Multiple Layers: If the data that the user is trying to convey requires layering or telling a story, interactive data visualization ensures that the user can immerse themselves in the information progressively, making the information presented more engaging.
Static vs Interactive Visualizations: Making the Decision
Whether to use static or interactive visuals depends on the current situation, the people using it,, or the content you are illustrating. Below are some factors to consider when making your decision:
- Audience Needs: Therefore, it is essential to have a technical understanding of the audience and how they will engage with the data. Brain advises that the latter are most valuable when they require a fast, broad view of the data in question, as static overviews are preferable. On the other hand, it is useful when the audience is more informed about the data and wants more insights. Interactive data visualization is more appropriate.
- Data Complexity: Simple static maps will do the trick for such data sets. Nonetheless, if you are working with big or more detailed data that needs additional analysis, interactive visualizations contain all the required features.
- Time and Resources: Again, static visualizations are more accessible to create than interactive ones and will likely take more time, effort, and expertise than their interactive counterparts. It is better to create something static if you’re on a time limit or limited with the money.
- Real-Time Data: Interactivity is the best choice for feeding the audience a real-time update or monitoring changes to performance metrics, for example. Static visuals aren’t capable of updating information automatically; they require manual intervention.
- Purpose of the Visualization: Static visuals are more effective if your goal is to present an undistorted story or an overview in general. Interactive visuals, on the other hand, are more valuable if you want to allow the users to dive further into a specific area or simply need to take them through several layers of information.
Static vs Interactive Visualizations: Choosing the Right Type
Here are some quick guidelines to help you decide when to use static or interactive visualizations:
Use Static Visualizations When:
- The data is simple and doesn’t require user interaction.
- You need to convey a high-level overview quickly.
- Time, resources, or technical expertise are limited.
- The audience needs consistent, easily shareable visuals.
Use Interactive Visualizations When:
- The data is complex and requires deeper exploration.
- The audience needs to customize their view or drill down into the data.
- Real-time updates are necessary.
- The goal is to create an engaging data storytelling experience.
Conclusion
Thus, static and interactive visualizations can be significant in contemporary data communication. Static visuals are easy to create and use when presenting simple data; on the other hand, Interactive visuals offer the interactivity and depth required when presenting complex data. Different audiences, the complexity of the data, and the goal direct the choice of the correct type of visualization.
Whether stunning graphics are used as static images or turned into an actual game that the viewer can interact with, both forms can turn non-personalized and generalized figures into meaningful and tailored information that can be used to promote enhanced decision-making.